
Imagine, just for a moment, that you lived in a time and place where you had absolutely NO IDEA what the weather was going to be like tomorrow. There could be a hurricane on the horizon, or a snowstorm, or an extreme heat wave.... and you would have no idea. While you might be able to predict basic weather patterns based on recurring seasonal changes, the precision and accuracy of weather forecasting today is relatively impressive. The general practice of forecasting is basically making predictions based on the information and data we have NOW. Forecasting is not necessarily a “crystal ball” that we use to see into the future, but it may be the closest we can get. And you can certainly apply forecasting to address questions besides “what is the temperature going to be tomorrow?”. Whether it involves high-tech monitoring equipment, complex mathematical models, or some person claiming to have an expert opinion, forecasting is exceedingly useful. This week, we’ll take a look at how forecasting is applied in the fields of politics, meteorology and climate, and economics. I’m forecasting that this is going to be an interesting article, but read on to find out...
Political Forecasting
As tumultuous as politics seems to be, the serious forecasting of democratic elections has been taking place for around 40 years. Election forecasting gained this widespread attention in the 1980s after a Yale University professor, Ray Fair, developed a forecasting model that projected George H.W. Bush’s victory over Dukakis in the 1988 Presidential election. At the time of the forecast, many thought Dukakis held a decent lead over Bush, so media outlets soon took interest in this oh-so-magical forecasting of elections. As we’ve seen in elections since the 1980s, though, there are plenty of times that an election forecast can go wrong. Forecasts can be helpful, though, by gauging which political issues are most important to a voting population during a particular election. I’ll give you a hint: the condition of the economy is typically one of the most prominent political issues when it comes to elections.
As a preface to discussing the many factors that play a role in forecasting the outcome of an election, it is important to note the quality of a forecast. For example, I could say that my forecast is correct nearly 100% of the time, but the reason is because the error bars on my prediction are absolutely massive.
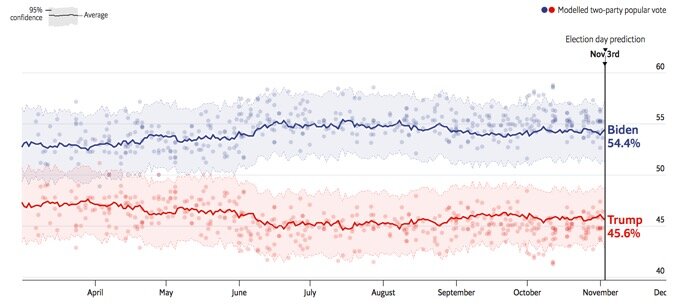
The error bars on these 2020 presidential election forecasts are around +/-2%, and the forecast started many months prior to Election Day, which is pretty good. It’s important, though, to notice that this is just the popular vote and not Electoral College.
The quality of election forecasts is generally rated in terms of predictive success (well, duh), how narrow the predictive bounds are (whether the error bar or uncertainty is small), and how far in advance the forecast can be made. Paying attention to the error or uncertainty in the forecast is extraordinarily important when considering elections in particular since in some cases the high-stakes elections are split nearly 50/50, and the forecasts may be unable to predict one candidate or the other with any significant degree of confidence. It is also good practice to keep in mind the goal of a given forecast. For example, forecasting the popular vote in a United States Presidential election may not be as beneficial as forecasting the Electoral College outcome, since the Electoral College results decide who wins the election.
Now, let’s consider some of the factors that election forecasts typically take into account when attempting to predict the the results of an election:
Polling: This one is pretty obvious, and typically what we hear a great deal about during election season. With polling, it is as simple as gauging the opinion of a sample of the entire population. Polling itself may be considered a type of forecast, although in many cases the results of polls are highly unreliable until up to a few days before an election. For the US presidential elections occurring between 1948 and 1992, the leader in Gallup Polls during the month of June won 7 times and lost 5, which is relatively poor accuracy for being 5 months prior to the election. Polls can also have degree of “house effect”, which is basically the bias of whoever is conducting the poll.
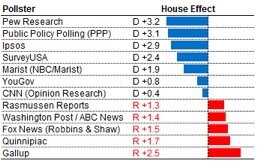
What about the house effect bias of whoever came up with these values? (D=Democratic candidate Obama, R=Republican candidate Romney during the 2008 election)
This house effect bias can have a significant effect on the results of the poll, with some models predicting a bias of more than 3% towards one US presidential candidate during the 2008 Presidential election. Polls can be more than just, “who are you voting for”, though, and can incorporate opinions on major societal issues or current presidential approval rating, which can be helpful in gauging the intangibles of public opinion.
Economy: The condition of the economy remains one of the major ways that election outcomes are predicted, and at least one economic indicator is used in every election forecasting model. Different economic metrics may be incorporated into a forecast, such as unemployment, Gross Domestic Product, personal income growth, or general economic growth. These metrics are used to measure whether the current political party or individual in a position of power is “doing well”. This concept of voting based on the performance of the people currently in power is called retrospective voting. If the economy is booming, why remove the people in public office? Vice versa, it’s no wonder Herbert Hoover didn’t get elected to a second term for President after the Great Depression started under his Presidency, whether it was his fault or not. Economic indicators are not the only factor in an election, though, and there are plenty of other political issues that people care about.
Incumbency and Political Experience: This one is highly dependent on what type of election you’re looking to forecast. For US Presidential elections, there is empirical evidence from multiple studies that shows voters have a periodic desire for change and are less likely to vote for the party in power after the party has been in office for multiple terms. For congressional and gubernatorial elections, though, the incumbent nearly always has an advantage over a challenger. Similarly, those with more political experience are usually more likely to win in Senate and gubernatorial elections.
Past Election Results: Comparing how people voted in the past is helpful in determining how they will vote in the future. While people don’t always vote along party lines and major issues of public concern change over time, the overall behavior of a population in the past is a good predictor of the future. As an example, you can think of how certain states in the United States may be considered “blue states” if they usually vote Democrat or “red states” if they usually vote Republican.
Miscellaneous: There are literally endless possibilities for other factors to consider when making a forecast. For example, some models take into account military fatalities as a predictor for election results, since high military fatalities is typically a detriment to the current party in power. Other issues that voters consider when weighing their options for candidates may include policy stances on crime, foreign policy, or the environment, which influences the election outcomes.
One cool example of other indicators comes from a model developed by the folks over at The Economist. They compared demographic and political profiles of various states to see how the election results of one state can be used to predict the outcome in another state. With their published data you can see which states are similar and which ones are different based on a multitude of demographic and political factors. Looking at the data, the state with the highest average similarity to other states was Michigan, whereas the state with lowest average similarity to other states was Hawaii (or District of Columbia if you count that as a state).
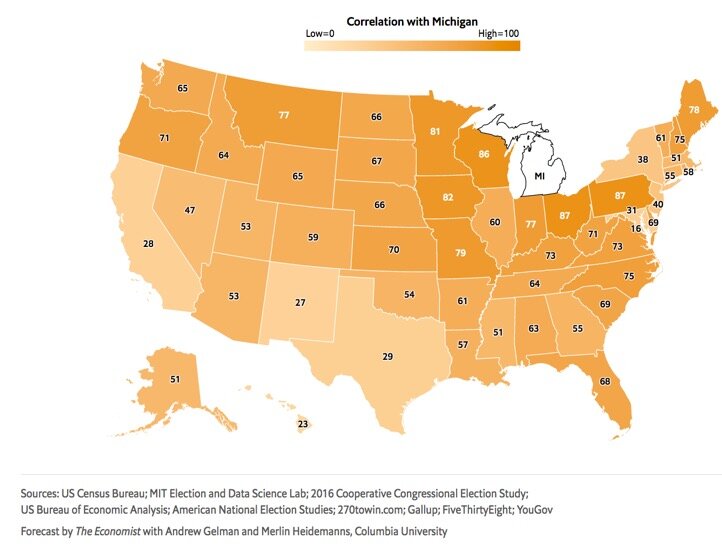

Calculated average correlation of each state with other states. Some states, like Michigan which has an average correlation of 61%, are very similar to most other states.
While it can be nice to predict an election outcome, an alternate form of elections that would prevent any form of forecasting has been proposed as a thought experiment: lottery voting. Lottery voting bypasses the complexity of forecasting and truly creates a randomized election result. It works as you might expect: everybody votes as they would normally, the votes are counted, and the winner is selected randomly using probabilities based on the voting results. To visualize it more easily, you could say that 100 people vote by writing down either Candidate A or Candidate B’s name on a sheet of paper. Sixty people vote for Candidate A and forty vote for Candidate B. Those paper votes get thrown into a bowl, and someone randomly selects a paper vote from that bowl. Whoever’s name is on the selected paper wins! While Candidate A had a 60% chance of winning, Candidate B still has a shot based on random selection.
This may sound insane, but it actually may create a few benefits. For one, people that are normally discouraged to vote by being in a minority or thinking that “their vote doesn’t count” would be more incentivized since whoever they vote for has a chance – however slim – to win. Term limits are also built-in to this system of voting as well, since the likelihood is slim that one candidate will continually win elections unless they receive close to 100% of the vote.
I have my doubts that many countries will adopt this voting lottery system, so maybe it’s best we stick with our election forecasting.
Meteorology & Climate Forecasting
Forecasting in the realm of meteorology and climate is probably familiar to most of us. Back in the old days (I’m talkin’ 300 B.C. and earlier here), civilizations could only attempt to predict short-term weather patterns based on clouds and long-term weather patterns based on seasonal calendars. The philosopher Aristotle even came up with theories regarding rain, hurricanes, wind, lightning, clouds, etc. that were mostly incorrect, but these theories were adhered to for close to 2,000 years.
Finally, we get to the era of the Renaissance (around the year 1500) when instruments were developed for measuring temperature, pressure, and humidity, which are important parameters for forecasting weather. The invention of the telegraph in the mid-1800s also improved weather forecasting by allowing people to communicate weather observations over long distances in a short amount of time. In this way, rough estimates of storm systems and weather maps could be developed. Jump ahead to the early 1900s, and we see the development of theories on atmospheric circulation and precipitation. The use of radio technology during this time combined with the use of radiosondes (the device strapped to a weather balloon) allowed researchers to get a clearer picture of weather conditions at higher altitudes in the atmosphere.

A weather balloon equipped with a radiosonde being released. Weather balloons such as this are released all over the globe every single day.
Predicting weather using numerical models truly kicked off around 1950 with meteorologist Jule Charney, who was one of the pioneers of numerical weather forecasting. Since this initial work, computers have been integrated along with satellite data in order to provide more accurate data and more complex models for predicting weather.
Today, meteorologists use a combination of stationary and mobile automated surface-observing systems, detailed satellite images, Doppler radar, supercomputers, ocean-based weather buoys, the ol’ reliable radiosonde, and volunteer observers to collect and process a huge amount of data pertaining to the current state of weather. Forecasts have improved greatly as well. In 1975, a temperature forecasted five days in advance could be off by as much as 7°F, whereas today that has decreased to an error of closer to 5°F. These days, you can even take a look at current and historical global weather data at different altitudes in the atmosphere from the comfort of your home here: https://earth.nullschool.net
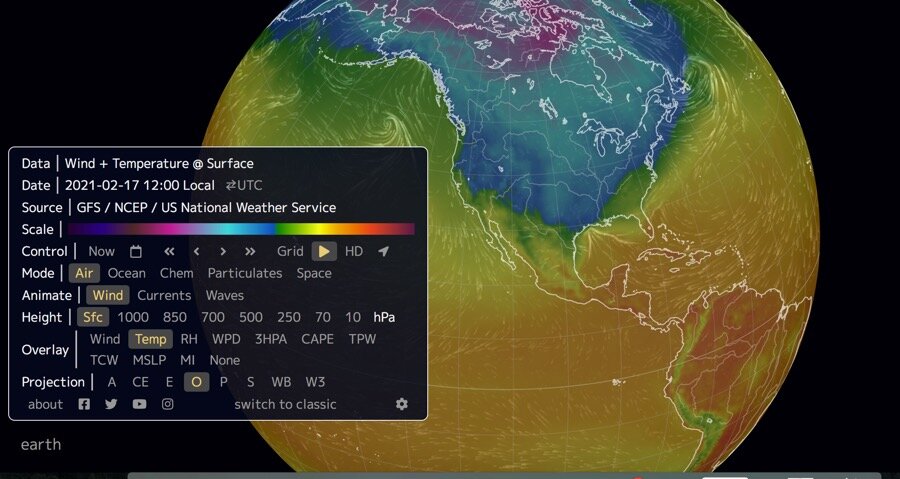
This image of surface temperatures comes from February 17th, 2021. Notice the colder (blue-colored) temperatures that dipped into the southern United States and caused freezing conditions and widespread power outages a few weeks ago.
When it comes to the numerical models, we’re talking about basic physics and chemistry... just applied over a massive global scale with nearly an infinite number of factors. After all, weather is primarily derived from uneven distribution of the sun’s heat across the Earth’s surface. It then starts to get interesting when you have to account for the amount of the sun’s energy that gets reflected or absorbed in the atmosphere, how much of the sun’s energy hits the ground versus water, the condensation and evaporation of water as that energy is absorbed or released (the water cycle!), the rotation of the Earth, ocean currents, mountains or geographic features that affect wind patterns, and the list goes on and on... and on. These numerical forecasts work by taking a snapshot of the current state of the Earth – such as temperature, humidity, and pressure at various locations and altitudes – and applying our understanding of fluid dynamics and other scientific principles to calculate what those parameters will be one minute from now, and then one minute after that, and so it goes on and on until you get your five-day forecast. For example, a basic applied scientific principle is that areas of higher air pressure typically move towards areas of lower air pressure, so a high-pressure weather system will probably move towards areas of lower pressure over time, although you still need to take into account a whole slew of other factors.

A hurricane forecast from the NOAA National Hurricane Center. Models developed specifically for hurricanes are better for modeling these storms compared to the general ECMWF and GFS models.
Two of the most popular forecasting models include the European Center for Medium-Range Weather Forecasts (ECMWF) and the Global Forecasting System (GFS). While these two are very popular and have proved to be very accurate, other forecasting models are sometimes necessary to fill in the gaps, such as models that are tailored specifically for forecasting the path of hurricanes or ice storms.
Overall, each of these forecasting models simplify the real nature of the atmosphere and weather since real-life weather is just so complicated, and most models only predict weather at intervals of 10 miles apart even though weather can change over the span of less than a mile. Tiny errors in collected weather data as well as the complexity of real life are why forecasting out more than 5 to 7 days starts to become less and less reliable. When you try to forecast out weeks in advance, models become so unreliable that we only really rely on statistics and historic weather patterns to predict weather.
So how do we forecast something that is WAY more than 5 to 7 days out, such as climate patterns that may change decades in the future? Well, climate forecasting is very similar to weather forecasting. Climate models, however, typically take a broader approach and only forecast average temperatures over larger regions (close to 100 square kilometers) as opposed to the specifics demanded by weather forecasts with changes occurring over less than an hour and within 1 square mile. Additionally, climate forecasting usually accounts for more complex Earth systems such as ocean circulation, volcanoes, melting of glaciers, the carbon cycle, atmospheric chemistry, the effects of human development, and changes in the sun’s radiation.
Whereas weather models can be tested fairly quickly (you only have to wait a few days to see if the forecast pans out), climate models aren’t so lucky. Let’s just wait 20 years, and then we’ll finally see whether the model is accurate, right? Sort of. The people making climate forecasts may apply the model to historical data to see how well it matches, but tracking the forecast over decades is still probably the best method. Looking at how actual data compared to climate forecasts, a number of the climate forecasts have actually been relatively accurate since they were projected forward from around the year 2000. At this point, though, it’s still difficult to comment on their accuracy since Earth’s climate is extraordinarily complex and takes place over more than two decades. The various climate forecasts take different factors into consideration, so the results of each individual forecast may vary. Overall, though, averaging a large number of forecasts can sometimes result in the highest accuracy. Most of these forecasts primarily address surface temperatures as an indicator of future weather.
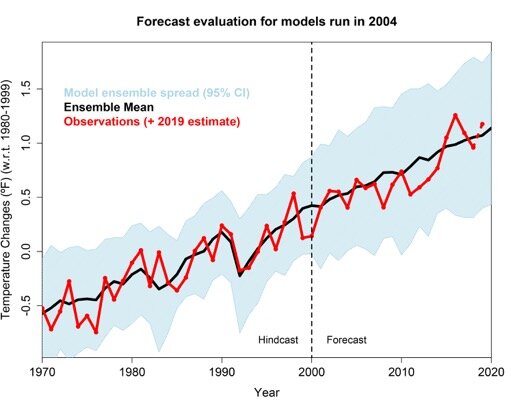
Actual surface temperature observations as compared to the average temperatures predicted by a number of climate models. The forecast occurred in 2000 with a comparison to data collected through 2020.
Economic forecasting

This figure provides general guidance on which forecasting techniques might be useful at each stage in a product’s life cycle, from development through to market dominance.
While some of us may be less concerned with politics or weather, money is something that many of us have to deal with at one point or another. Economic forecasting is used in arguably every business in order to help make decisions. For example...When should we make an investment or scale up? Do we need to hire more employees? Should we change product or service prices? What happens if we switch to another supplier? Great questions, but how is forecasting used to inform these decisions? In this section, we’ll talk about a few different general economic forecasting techniques, including qualitative forecasting, time series analysis, economic indicators, and causal models. You might also interpret these forecasting techniques as methods for choosing which stocks to invest in.
Qualitative forecasting techniques are less technical than the quantitative techniques, but they can still be very useful. In an “executive committee” approach, you basically ask employees from a variety of areas in a company to work as a team to develop a forecast. This technique leverages a variety of perspectives from within a company to reach a common prediction, similar to relying on expert opinion. The Delphi Method, which sounds fancy, is very similar to the executive committee approach. The Delphi Method also involves asking employees from a variety of areas, and sometimes external consultants as well, to generate a forecast... except each participant does so individually without the influence of outside opinions. The individual opinion of each participant is compiled into an anonymous list which is then presented back to all of the participants in order to reach a consensus based on the honest, individual opinions.
Instead of looking internally to generate a forecast, a business might also look to customer surveys or market research in order to generate a forecast. Forecasts may be generated using feedback from mail questionnaires, focus groups, customer calls, or other forms of interaction. A business could also look to history for guidance by creating a forecast using outcomes from a similar product or service. Which brings us to the next form of economic forecasting…

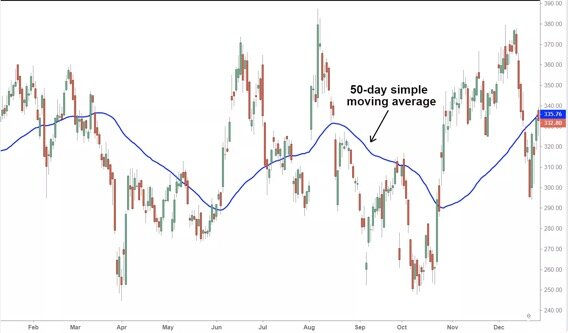
Notice with this 5-day moving average that the actual stock price moves up and down day-to-day, but the 5-day moving average shows that the stock price is steadily moving upwards over time!
Time series analysis. This form of forecasting is quantitative and most commonly involves moving averages as a quick and easy method. A moving average is almost exactly what it sounds like: you take the average of historical data points over a certain time period. This data can be anything from stock prices to product sales numbers. The trick here is that new data is collected and added to the historical data set continuously as older data gets dropped out of the data set. For example, a “5-day moving average” means that you calculate the average based on data only from the previous 5 days, so you’ll always kick out one data point and add one data point with each new day.
The benefit of a moving average is that you can smooth out data, which allows a forecast to be made without the influence of short-term fluctuations. You can also have a variety of moving averages that incorporate more or less historical data (e.g., a one-year moving average versus a 10-day moving average).
Look how smooth that moving average is.
Moving averages can get a bit more complex if you add a weighting factor to the mix. Weighted moving averages can be used to account more heavily for recent data as compared to older data, with an exponential moving average being one example of a weighted moving average. The exponential moving average is more sensitive to fluctuations since it gives stronger preference to recent data points, but this also means it is more responsive to change.
A drawback of using any type of moving average is that it doesn’t account for known cycles or trends. For example, you might expect ice cream sales to go up during the summer, but a 100-day moving average at the start of summer may not necessarily provide a good forecast for the peak season since sales will likely skyrocket compared to what you’ve seen over the past 100 days. Other examples of time series analyses used outside of moving averages might involve adding a simple linear trend line to historical data and extrapolating out into the future.
Economic indicators are usually simple metrics that help people measure the state of the economy and make forecasts accordingly. Different economic indicators are called leading indicators, lagging indicators, or coincident indicators. Lagging indicators are metrics that usually change only after major changes occur in the economy. Why should we care about a delayed indicator if we’re looking to make a forecast? Lagging indicators help define where we are in the business cycle and can help forecasters get their bearings in terms of increasing or decreasing trends in the economy. Lagging indicators could include the Consumer Price Index, corporate earnings, or the unemployment rate.

The sharper upward yield curve seen in January 2021 is a sign that people are more optimistic about the future of the economy than they were in February 2020.
Leading indicators are probably more relevant to forecasting since they are forward-looking indicators that usually change before major changes occur in the economy. These indicators are typically the main inputs used in statistical economic models, though they are not always entirely reliable. Leading indicators may include yield curves on bonds, consumer confidence index, or corporate capital expenditures. We typically like to see an upward-sloping yield curve, high consumer confidence index, and high capital expenditures as signs of economic growth. The housing market is also sometimes a good leading indicator, and the overall stock market also provides a good indicator of which direction the economy is moving. For example, the stock market crashed in early March 2020 in response to the COVID-19 outbreak, but the effects on the economy and employment were not felt until a few weeks or months later.
Coincident indicators lie right in the middle of leading and lagging indicators and provide a nice snapshot of the economy as it is now. These indicators might include average personal income or Gross Domestic Product (GDP).
Others have suggested other indicators, such as the “Lipstick Indicator”, which basically correlates the general state of the economy with lipstick sales. Apparently, lipstick sales – along with other cosmetics – go up during bad economic times. It’s uncertain how dependable this indicator is, BUT it’s a good example of how an indicator can emerge from nearly any metric.
Causal models are more complex than the other forecasting methods discussed so far, and can often incorporate time series analysis and economic indicators into their forecast. Causal models can only be reliably developed when a forecaster has a solid understanding of the relationships between various aspects of the economy or business. Causal models usually rely on several years of preceding data as well, so they’re not entirely reasonable for new products or businesses. A causal model may be developed using a number of input factors such as price, product inventory, or marketing efforts that have been shown to correlate well with some intended model output, such as projected revenue at a company. It’s a sort of cause-and-effect relationship among various input and output metrics (hence the “causal model” name). Causal models can be revised and refined over time as more information is collected and more accurate correlations are determined among the variables used.

This optimization of cost can shift depending on the situation, so sometimes complex forecasts are more cost effective while other times you may find that a simple forecast is more cost effective.
While an accurate causal model is clearly preferred, it’s also important to understand that forecasting costs money, so you should consider the return on investment when deciding between various forecasting techniques.
All in all, forecasting is pretty darn useful. While we only covered three subjects in this article (politics, weather/climate, and economics), the use of intuition and data to make informed predictions about the future can be applied nearly anywhere. Even the spread of infectious diseases can be forecasted, such as predicting the magnitude and timing of seasonal influenza. Always keep in mind that forecasts are not guarantees (even though we wish they were sometimes). But maybe that uncertainty helps keep life interesting. Like, what is the next Grow Weekly article going to be about?! You’ll have to wait to find out.
to think about…
Do you think the predictions of election forecasts impact the eventual outcome of an election, or do you think that election forecasts have no impact on how people vote? You could think about a situation where the forecasts suggest a landslide victory, for example.
Reflect on the resource you typically use to check the weather forecast (e.g., weather.com, National Weather Service, the local news, etc.). How does this resource generate the weather forecast and what types of equipment do they use? Do they borrow information or forecasting models from elsewhere?
Check out some of the following sources of US economic indicators:
https://www.bea.gov/news/glance
What do you think these indicators suggest: does the economy seem to be improving or worsening?
Sources
Hummel & Rothschild. Fundamental Models for Forecasting Elections, 2013. American Economic Association Proceedings. (https://www.aeaweb.org/conference/2013/retrieve.php?pdfid=88)
Dowding. Why Forecast? The Value of Forecasting to Political Science, 2020. American Political Science Association. DOI: 10.1017/S104909652000133X
Dassonneville & Tien. Forecasting the 2020 US Elections, 2020. American Political Science Association. DOI: 10.1017/S104909652000147X
Campbell & Mann. Forecasting the Presidential Election: What can we learn from the models?, 1 September 1996. The Brookings Institution. (https://www.brookings.edu/articles/forecasting-the-presidential-election-what-can-we-learn-from-the-models/)
Silver. Calculating ‘House Effects’ of Polling Firms, 22 June 2012. FiveThiryEight. (https://fivethirtyeight.com/features/calculating-house-effects-of-polling-firms/)
Graefe. Predicting elections: Experts, polls, and fundamentals, July 2018. Judgement and Decision Making. (https://www.sas.upenn.edu/~baron/journal/18/18124/jdm18124.html)
The Economist. Forecasting the US Elections, 3 November 2020. (https://projects.economist.com/us-2020-forecast/president)
The Economist. Meet our US 2020 election-forecasting model, 13 June 2020. (https://www.economist.com/united-states/2020/06/11/meet-our-us-2020-election-forecasting-model)
Amar. Lottery Voting: A Thought Experiment, 1995. University of Chicago Legal Forum. (https://chicagounbound.uchicago.edu/cgi/viewcontent.cgi?article=1183&context=uclf)
Buis. Study Confirms Climate Models are Getting Future Warming Projections Right, 9 January 2020. NASA’s Jet Propulsion Laboratory. (https://climate.nasa.gov/news/2943/study-confirms-climate-models-are-getting-future-warming-projections-right/)
Harper. What Are Climate Models and How Accurate Are They?, 18 May 2018. Earth Institute of Columbia University. (https://blogs.ei.columbia.edu/2018/05/18/climate-models-accuracy/)
Allegretto. Weather Forecast Models – Explained, 20 September 2019. OpenSnow. (https://opensnow.com/news/post/weather-forecast-models-explained)
Brookes. How's the Weather Out There? Forecasting the Chaos of Weather, ND. National Geographic. (https://www.nationalgeographic.com/environment/article/weather-forecasting)
National Oceanic and Atmospheric Association. 6 tools our meteorologists use to forecast the weather, 14 August 2017. (https://www.noaa.gov/stories/6-tools-our-meteorologists-use-to-forecast-weather)
National Oceanic and Atmospheric Association. Weather Forecasting Through the Ages, 25 February 2002. (https://earthobservatory.nasa.gov/features/WxForecasting/wx2.php)
Huffman. Weather Forecasting, ND. Scholastic Inc. (https://www.scholastic.com/teachers/articles/teaching-content/weather-forecasting/)
National Hurricane Center. Definition of the NHC Track Forecast Cone, 2020. (https://www.nhc.noaa.gov/aboutcone.shtml)
Namvar. Economic Forecasting, 2000. Graziadio Business Review. (https://gbr.pepperdine.edu/2010/08/economic-forecasting/)
Corporate Finance Institute. What is Economic Forecasting?, ND. (https://corporatefinanceinstitute.com/resources/knowledge/economics/economic-forecasting/)
Chambers, et al. How to Choose the Right Forecasting Technique, July 1971. Harvard Business Review. (https://hbr.org/1971/07/how-to-choose-the-right-forecasting-technique)
Potter. Leading, Lagging, and Coincident Indicators, 1 January 2021. Investopedia. (https://www.investopedia.com/ask/answers/what-are-leading-lagging-and-coincident-indicators/)
Scheid & Rocha. Treasury yield curve steepens to 4-year high as investors bet on growth rebound, 13 January 2021. S&P Global. (https://www.spglobal.com/marketintelligence/en/news-insights/latest-news-headlines/treasury-yield-curve-steepens-to-4-year-high-as-investors-bet-on-growth-rebound-62067561)
Corporate Finance Institute. Top Four Types of Forecasting Methods, ND. (https://corporatefinanceinstitute.com/resources/knowledge/modeling/forecasting-methods/)
Hayes. Simple Moving Average (SMA), 1 March 2021. Investopedia. (https://www.investopedia.com/terms/s/sma.asp)
Lutz, et al. Applying infectious disease forecasting to public health: a path forward using influenza forecasting examples, 2019. BMC Public Health. (https://bmcpublichealth.biomedcentral.com/articles/10.1186/s12889-019-7966-8)